Data Visualization in Society
by Martin Engebretsen, Helen Kennedy
DescriptionTable of ContentsDetailsHashtagsReport an issue 


Book Description
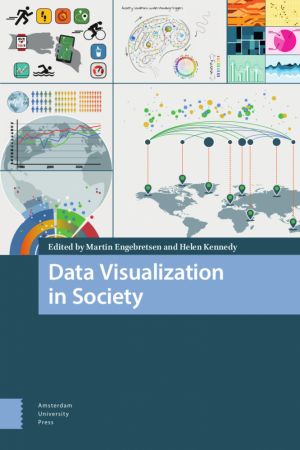
Today we are witnessing an increased use of data visualization in society. Across domains such as work, education and the news, various forms of graphs, charts and maps are used to explain, convince and tell stories. In an era in which more and more data are produced and circulated digitally, and digital tools make visualization production increasingly accessible, it is important to study the conditions under which such visual texts are generated, disseminated and thought to be of societal benefit. This book is a contribution to the multi-disciplined and multi-faceted conversation concerning the forms, uses and roles of data visualization in society. Do data visualizations do 'good' or 'bad'? Do they promote understanding and engagement, or do they do ideological work, privileging certain views of the world over others? The contributions in the book engage with these core questions from a range of disciplinary perspectives.This open book is licensed under a Creative Commons License (CC BY-NC-ND). You can download Data Visualization in Society ebook for free in PDF format (5.5 MB).
Table of Contents
Chapter 1
Introduction: The relationships between graphs, charts, maps and meanings, feelings, engagements
Chapter 2
Ways of knowing with data visualizations
Chapter 3
Inventorizing, situating, transforming: Social semiotics and data visualization
Chapter 4
The political significance of data visualization: Four key perspectives
Chapter 5
Rain on your radar: Engaging with weather data visualizations as part of everyday routines
Chapter 6
Between automation and interpretation: Using data visualization in social media analytics companies
Chapter 7
Accessibility of data visualizations: An overview of European statistics institutes
Chapter 8
Evaluating data visualization: Broadening the measurements of success
Chapter 9
Approaching data visualizations as interfaces: An empirical demonstration of how data are imag(in)ed
Chapter 10
Visualizing data: A lived experience
Chapter 11
Data visualization and transparency in the news
Chapter 12
What is visual-numeric literacy, and how does it work?
Chapter 13
Data visualization literacy: A feminist starting point
Chapter 14
Is literacy what we need in an unequal data society?
Chapter 15
Multimodal academic argument in data visualization
Chapter 16
What we talk about when we talk about beautiful data visualizations
Chapter 17
A multimodal perspective on data visualization
Chapter 18
Exploring narrativity in data visualization in journalism
Chapter 19
The data epic: Visualization practices for narrating life and death at a distance
Chapter 20
What a line can say: Investigating the semiotic potential of the connecting line in data visualizations
Chapter 21
Humanizing data through 'data comics' An introduction to graphic medicine and graphic social science
Chapter 22
Visualizing diversity: Data deficiencies and semiotic strategies
Chapter 23
What is at stake in data visualization? A feminist critique of the rhetorical power of data visualizations in the media
Chapter 24
The power of visualization choices: Different images of patterns in space
Chapter 25
Making visible politically masked risks: Inspecting unconventional data visualization of the Southeast Asian haze
Chapter 26
How interactive maps mobilize people in geoactivism
Book Details
Title
Data Visualization in Society
Publisher
Amsterdam University Press
Published
2020
Pages
466
Edition
1
Language
English
ISBN13 Digital
9789463722902
ISBN10 Digital
9463722904
PDF Size
5.5 MB
License

Related Books
A short course for students to increase their proficiency in analyzing and interpreting data visualizations. By completing this short course students will be able to explain the importance of data literacy, identify data visualization issues in order to improve their own skills in data story-telling. The intended outcome of this course is to help s...

Python is one of the leading open source platforms for data science and numerical computing. IPython and the associated Jupyter Notebook offer efficient interfaces to Python for data analysis and interactive visualization, and they constitute an ideal gateway to the platform.
IPython Interactive Computing and Visualization Cookbook, 2nd Edition ...
The demand for skilled data science practitioners in industry, academia, and government is rapidly growing. This book introduces concepts and skills that can help you tackle real-world data analysis challenges. It covers concepts from probability, statistical inference, linear regression and machine learning. It also helps you develop skills such a...

D3 Tips and Tricks is a book written to help those who may be unfamiliar with JavaScript or web page creation get started turning information into visualization.
Data is the new medium of choice for telling a story or presenting compelling information on the Internet and d3.js is an extraordinary framework for presentation of data on a web page....

The second volume in the SIRCA book series investigates the impact of information society initiatives by extending the boundaries of academic research into the realm of practice. Global in scope, it includes contributions and research projects from Asia, Africa and Latin America. The international scholarly community has taken a variety of approach...
When you combine the sheer scale and range of digital information now available with a journalist's "nose for news" and her ability to tell a compelling story, a new world of possibility opens up. With The Data Journalism Handbook, you'll explore the potential, limits, and applied uses of this new and fascinating field.
This ...

